File:Graph1.png
Graph1.png (493 × 453 pixels, file size: 19 KB, MIME type: image/png)
Summary[edit]
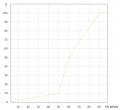
Graph item price versus item hit points. Some equations for this graph: price(%)=h ; hit points=d
| d(%) | 0-50 | 50-60 | 60-90 |
|---|---|---|---|
| h= | d/5 | 4d-190 | 5d/3 - 50 |
| d= | 5h | (h+190)/4 | 3( h+50)/5 |
0.061sqh=n
Licensing[edit]
| This file has been released into the public domain by the copyright holder, its copyright has expired, or it is ineligible for copyright. This applies worldwide. |
File history
Click on a date/time to view the file as it appeared at that time.
| Date/Time | Thumbnail | Dimensions | User | Comment | |
|---|---|---|---|---|---|
| current | 08:24, 6 April 2021 |  | 493 × 453 (19 KB) | Dimid (talk | contribs) | Graph item price versus item hit points |
You cannot overwrite this file.
File usage
The following 4 pages use this file:
